June 6, 2013
to be posted on nobabies.net
Charles Wheelan
6082 Rockefeller Hall
Dartmouth College
Hanover NO 03755
charleswheelan@gmail.com
Dear Professor Charles Wheelan:
I enjoyed your charming book (Naked Statistics W. W. Norton & Co. New York, 2013). One thing puzzled me. I thought you said that the probability of at least one of two independent events occurring was the sum of their individual probabilities. I generally handle that by subtracting each probability from one, multiplying the difference and subtracting the product from one.
Thank you for clarifying the issue of “skew.” I thought I had remembered from high school that a left skewed curve went up fast and down slow, while a right skewed curve did the opposite. For me that covers the bulk of the data under the curve and potentially helps sort out what the underlying mechanism might be. Modern usage is related to the tails of the curve, where the data are deviled by low numbers and to me are of little interest. I used the word “skew” in a recent paper, perhaps inappropriately. I am attaching the paper. As you can see the tails of the curves are obscured by adjacent curves, but the way the peak leans is still evident. Mea cupa.
I did have a couple of questions I though your book might address, but it did not seem to. If you look at the history of southern Mesopotamia, comparing the ages of regimes with their chance of another fifty years of survival you get this:
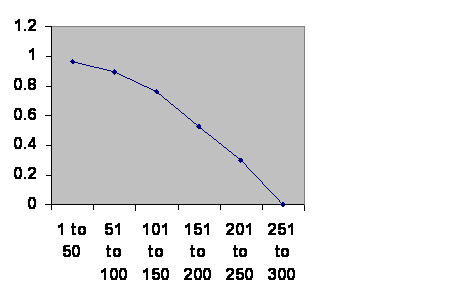
Information taken from R. H. Carling THE WORLD HISTORY CHART International Timeline Inc. Vienna, VA 1985. The experience of Southern Mesopotamia. The vertical axis is The chance of an empire of any age continuing to rule locally for another 50 years. The horizontal axis is the ages of the empires. I broke down the Ottoman Empire into two regimes since at one point they changed to way they recruited Janissaries, the elite soldiers and the administrators.
The regularity of the curve seems to me to suggest steps, each going down and each (except once) going down steeper. That can’t happen by chance more than once in a hundred times. (p < .01) If you do the same analysis for Rome, Mayans and the Anasazi:
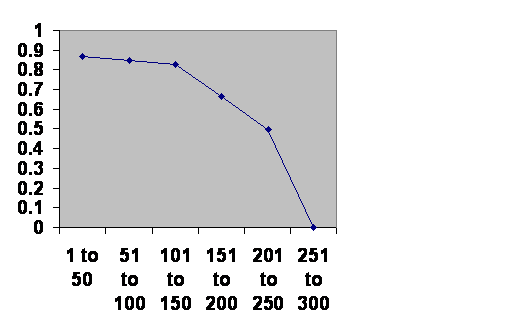
This pools the classical Mayans with the Romans and the Chaco Canyon Anasazi. Information taken from BBC and Tainter. The age of each regime when it fell is on the horizontal axis in 50 year increments. The vertical axis is its chance of surviving that half century after it has entered that half century.
There is just no way this could be chance. (p < .0001) Other areas are harder to analyze. Egypt shows something similar although with exceptions, and England requires some hand waving.
I am content to say this is no fluke and proceed accordingly. But there is another statistical issue:
First here are data from a study done in Iceland:
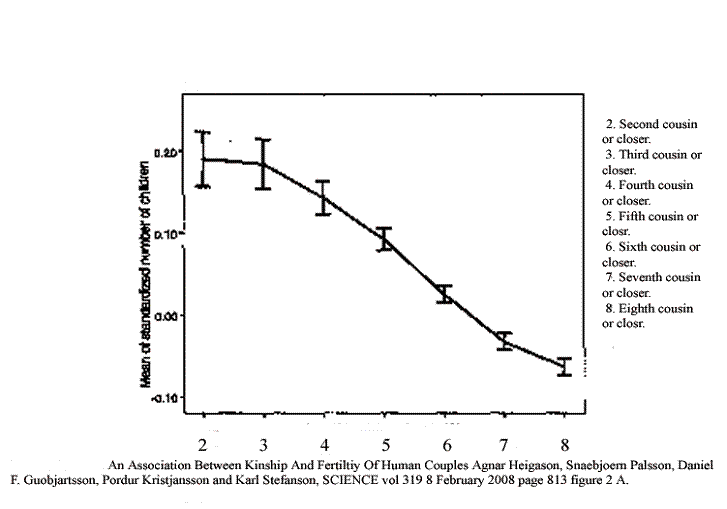

(That’s “Helgason.” Sorry.) The error bars are very tight. Again it is no fluke. And of course if you don’t have enough babies your regime is doomed. Here’s what they got looking at grandchildren.
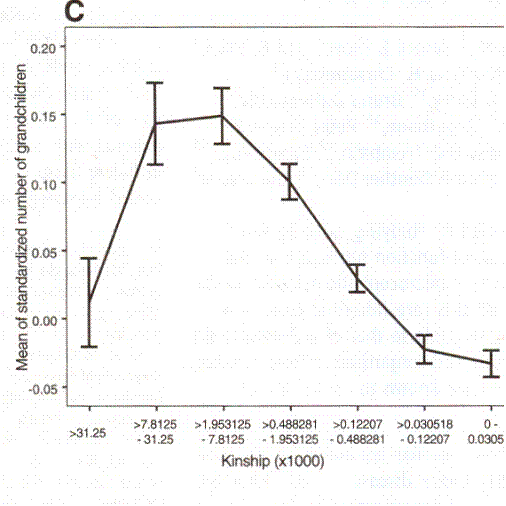
An Association Between Kinship And Fertility of Human Couples, Agnar Helgason, Snaebjoern Palsson, Daniel F. Guobjartsson, Pordur Kristjansson and Karl Stefanson, SCIENCE vol. 319 8 February 2008 page 813 figure 3.
Without claiming to have done a formal statistical analysis, it looks to me that most of the limited variation in the first graph is accounted for by the variation in the second graph and vice versa.
We could have guessed this because it is evident that the infertility from failing to marry kin accumulates over multiple generations.
But I have a bit of a problem with the Iceland data. It has been “normalized.” That means the fertility rate for each degree of kinship has been compared with the overall fertility. But it is not clear to me whether they normalized every year or used a pooled fertility rate for the duration of the study. So my question is which is the usual routine?
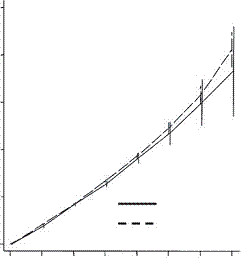
The second question regards a study done by the Royal Society. I bought a copy of the paper ((Low fertility increases descendant socioeconomic position but reduces long-term fitness in a modern post-industrial society Proc. R. Soc. B 2012 279, 4342-4351 first published online 29 August 2012 Anna Goodman, Ilona Koupil and David W. Lawson) But they have taken precautions against being copied. I did manage to snatch some graphs, but not the formal labeling of axes.
The paper looked at data from Sweden that let them describe the success of rich people in having rich children. That looked pretty good. They also looked at reproductive success. They found that rich people had fewer children, which is well recognized and is usually attributed to the idea that rich people invest more in their children. But after a couple of generations that increased investment was not making up for the lack of children. Here are some graphs:
This graph shows basically number of children on the vertical axis. The horizontal axis breaks it down into numbers of children, more toward the right. The dotted line is the number of children poor people have. The solid line is the number for rich people. As you see, the richer families have fewer children.
Here goes grandchildren:
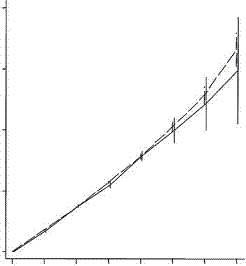
It’s just as bad. All that extra investment and the children still return fewer grandchildren than the children of poor people.
Now this particular study went so far as to look at great grandchildren. One might reasonably expect that the income of a family to have little or no effect on the number of great grandchildren. Three generations have passed. The effect should have faded. But here is the experience with great grandchildren:
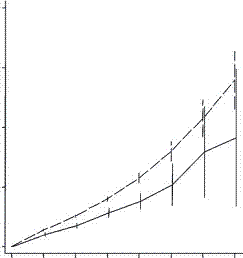
The effect didn’t go away. It got worse. It got a lot worse. But we should have known this was going to happen. A man leaves his little squalid village and goes out into the great world and makes his fortune. He marries a trophy wife, certainly not from his home town. They have fewer children that his brothers have back home; we know that from the Iceland data. And they have fewer grandchildren, we know that. And by the time the next generation rolls around they have all but forgotten the village so of course they continue to marry non kin.
It looks to me that in the first generation, normalized fertility is maximum at about second cousin and about bottoms out at 8th cousin. The loss is about .25 or a 25% loss of fertility. That alone would be no great problem. Then in the second generation there is a drop of about .2. Well I make that out to be .75 left after the first generation and .8 left after the second leaving 60 % of maximum fertility or a 40 % loss for those who have gone two generations without marrying cousins. Then in the next generation, well from the Swedish data it looks like it gets worse. Like maybe it’s twice as bad. If that is a 50% loss then, overall it is an 80% drop or maybe one child where there would have been five. If the physiologic limit for the average woman is 12, she is just teetering on replacement. If it’s fifteen, then she has three. In the modern day and age in the developed world she is down to less than two (we haven’t been marrying cousins for many years) and it seems to me that we have a very significant issue.
But the graphs do make me squirm. Am I correctly reading the Swedish data? Goodman declined to analyze the next generation after great grandchildren. She said something like “you can’t add up what happens until the generation is over.” I fear she turned up some very bad news and doesn’t want to say it. Anyway, can you interpret the graphs? Alas you’d need to look up the original article. I’d be happy to pay for a copy for you.
Well those are my questions. Thank you for your time so far.
Sincerely,
M. Linton Herbert MD
There have been 85 visitors over the past month.
Home page.